mermaid.js のフローチャートに画像を表示させます。
はじめに
mermaid.js とは、JavaScript製のフローチャート作成ライブラリです。複雑なフローチャートやシーケンス図が簡単に書けちゃいます。
mermaid.js 公式サイトはこちら
で、今回フローチャートに画像を表示させたかったのですが、思いのほか上手くいかず四苦八苦してやっと表示できるようになったので紹介します。
完成系
手っ取り早く完成系から紹介します。
1
2
3
4
5
6
7
8
9
10
11
12
13
14
15
16
17
18
19
20
21
22
23
24
25
26
27
28
29
30
31
32
33
34
35
36
37
38
39
40
41
42
43
44
45
46
47
48
49
50
51
52
53
54
55
56
57
58
59
60
61
62
63
64
65
66
67
68
69
70
71
72
73
74
75
| <html>
<head>
<link href="https://cdnjs.cloudflare.com/ajax/libs/mermaid/6.0.0/mermaid.css" rel="stylesheet" />
<script src="https://cdnjs.cloudflare.com/ajax/libs/mermaid/6.0.0/mermaid.js"></script>
<script>
window.onload = function () {
var mermaidAPI = mermaid.mermaidAPI;
var config = {
startOnLoad: false,
htmlLabels: true,
callback: function (id) {
console.log(id, ' rendered');
},
flowchart: {
useMaxWidth: false,
}
};
mermaid.initialize(config);
var element = document.getElementById("app");
var insertSvg = function (svgCode, bindFunctions) {
element.innerHTML = svgCode;
};
var graphDefinition = `
graph LR
subgraph \u5e7c\u5e74\u671f
botamon(<img src='https://digimon.net/cimages/digimon/botamon.jpg' width='40' height='40' /><br>\u30dc\u30bf\u30e2\u30f3)
koromon(<img src='https://digimon.net/cimages/digimon/koromon.jpg' width='40' height='40' /><br>\u30b3\u30ed\u30e2\u30f3)
end
subgraph \u6210\u9577\u671f
agumon(<img src='https://digimon.net/cimages/digimon/agumon.jpg' width='40' height='40' /><br>\u30a2\u30b0\u30e2\u30f3)
betamon(<img src='https://digimon.net/cimages/digimon/betamon.jpg' width='40' height='40' /><br>\u30d9\u30bf\u30e2\u30f3)
end
subgraph \u6210\u719f\u671f
greymon-first(<img src='https://digimon.net/cimages/digimon/greymon-first.jpg' width='40' height='40' /><br>\u30b0\u30ec\u30a4\u30e2\u30f3)
tyranomon(<img src='https://digimon.net/cimages/digimon/tyranomon.jpg' width='40' height='40' /><br>\u30c6\u30a3\u30e9\u30ce\u30e2\u30f3)
devimon(<img src='https://digimon.net/cimages/digimon/devimon.jpg' width='40' height='40' /><br>\u30c7\u30d3\u30e2\u30f3)
meramon(<img src='https://digimon.net/cimages/digimon/meramon.jpg' width='40' height='40' /><br>\u30e1\u30e9\u30e2\u30f3)
airdramon(<img src='https://digimon.net/cimages/digimon/airdramon.jpg' width='40' height='40' /><br>\u30a8\u30a2\u30c9\u30e9\u30e2\u30f3)
seadramon(<img src='https://digimon.net/cimages/digimon/seadramon.jpg' width='40' height='40' /><br>\u30a8\u30a2\u30c9\u30e9\u30e2\u30f3)
numemon(<img src='https://digimon.net/cimages/digimon/numemon.jpg' width='40' height='40' /><br>\u30cc\u30e1\u30e2\u30f3)
end
subgraph \u5b8c\u5168\u4f53
metalgreymon-v(<img src='https://digimon.net/cimages/digimon/metalgreymon-v.jpg' width='40' height='40' /><br>\u30e1\u30bf\u30eb\u30b0\u30ec\u30a4\u30e2\u30f3)
mamemon(<img src='https://digimon.net/cimages/digimon/mamemon.jpg' width='40' height='40' /><br>\u30de\u30e1\u30e2\u30f3)
monzaemon(<img src='https://digimon.net/cimages/digimon/monzaemon.jpg' width='40' height='40' /><br>\u3082\u3093\u3056\u3048\u30e2\u30f3)
end
botamon-->koromon
koromon-->agumon
koromon-->betamon
agumon-->greymon-first
agumon-->tyranomon
agumon-->devimon
betamon-->devimon
agumon-->meramon
betamon-->meramon
betamon-->airdramon
betamon-->seadramon
agumon-->numemon
betamon-->numemon
greymon-first-->metalgreymon-v
devimon-->metalgreymon-v
airdramon-->metalgreymon-v
tyranomon-->mamemon
meramon-->mamemon
seadramon-->mamemon
numemon-->monzaemon
`;
var graph = mermaidAPI.render("mermaid", graphDefinition, insertSvg);
};
</script>
</head>
<body>
<div id="app"></div>
</body>
</html>
|
これを HTML に張り付けてブラウザで表示させると、こんなフローチャートが表示されます。
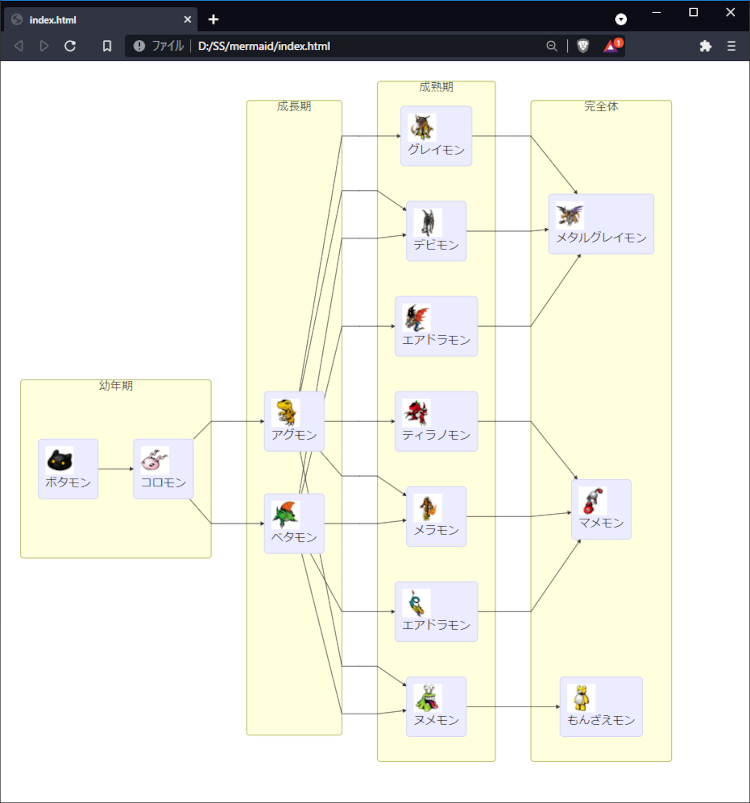
なんでデジモンなのかは置いておいて、こんな感じにフローチャート内に画像を表示することができます。
つまづいた点
render関数 を通さないと画像が表示できない
mermaid.js は HTML内に直接書けるように出来ているのですが、画像を表示させるために、JavaScript の mermaidAPI.render関数 を通さないと画像が表示できませんでした。
例えば、このように書くだけでフローチャートができちゃうんですよ、普通は。
1
2
3
4
5
6
7
8
9
10
11
12
13
14
15
16
| <html>
<head>
<link href="https://cdnjs.cloudflare.com/ajax/libs/mermaid/6.0.0/mermaid.css" rel="stylesheet" />
<script src="https://cdnjs.cloudflare.com/ajax/libs/mermaid/6.0.0/mermaid.js"></script>
<script>mermaid.initialize({ startOnLoad: true });</script>
</head>
<body>
<div class="mermaid">
graph LR
A[Hard edge] -->|Link text| B(Round edge)
B --> C{Decision}
C -->|One| D[Result one]
C -->|Two| E[Result two]
</div>
</body>
</html>
|
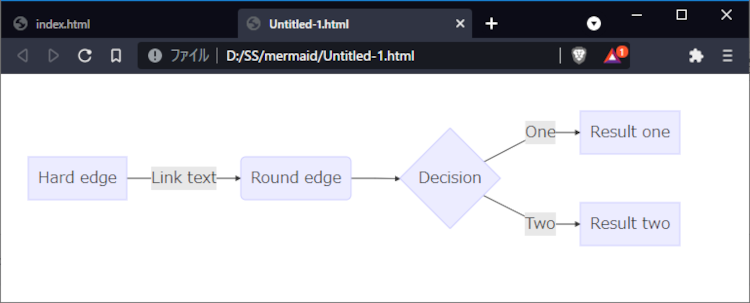
この書き方が出来なかったのが辛かった。
参考
https://stackoverflow.com/questions/42402912/how-to-embed-an-image-in-a-node-with-mermaid-js
日本語表示が出来なかった
え?いや、出来てるじゃん。って思ったと思いますが、日本語を1文字ずつわざわざ Unicodeエスケープシーケンス に変換して表示しています。
日本語の変換にはこちらを使わせてもらいました。
Unicodeエスケープシーケンス変換ツール
わざわざ変換するのがクソめんどくさい。
おわりに
そんなこんなで、JavaScript製のフローチャート作成ライブラリの紹介でした。